
SNF payer rates from Transparency in Coverage data
What insurers' price files show about nursing-home rates, and what they leave out.
BARA Analytics collects and cleans these files for nursing homes in its SNF Insights platform, with current commercial rates from 14 payers for 12,849 of the 14,690 Medicare-certified nursing homes in the country.
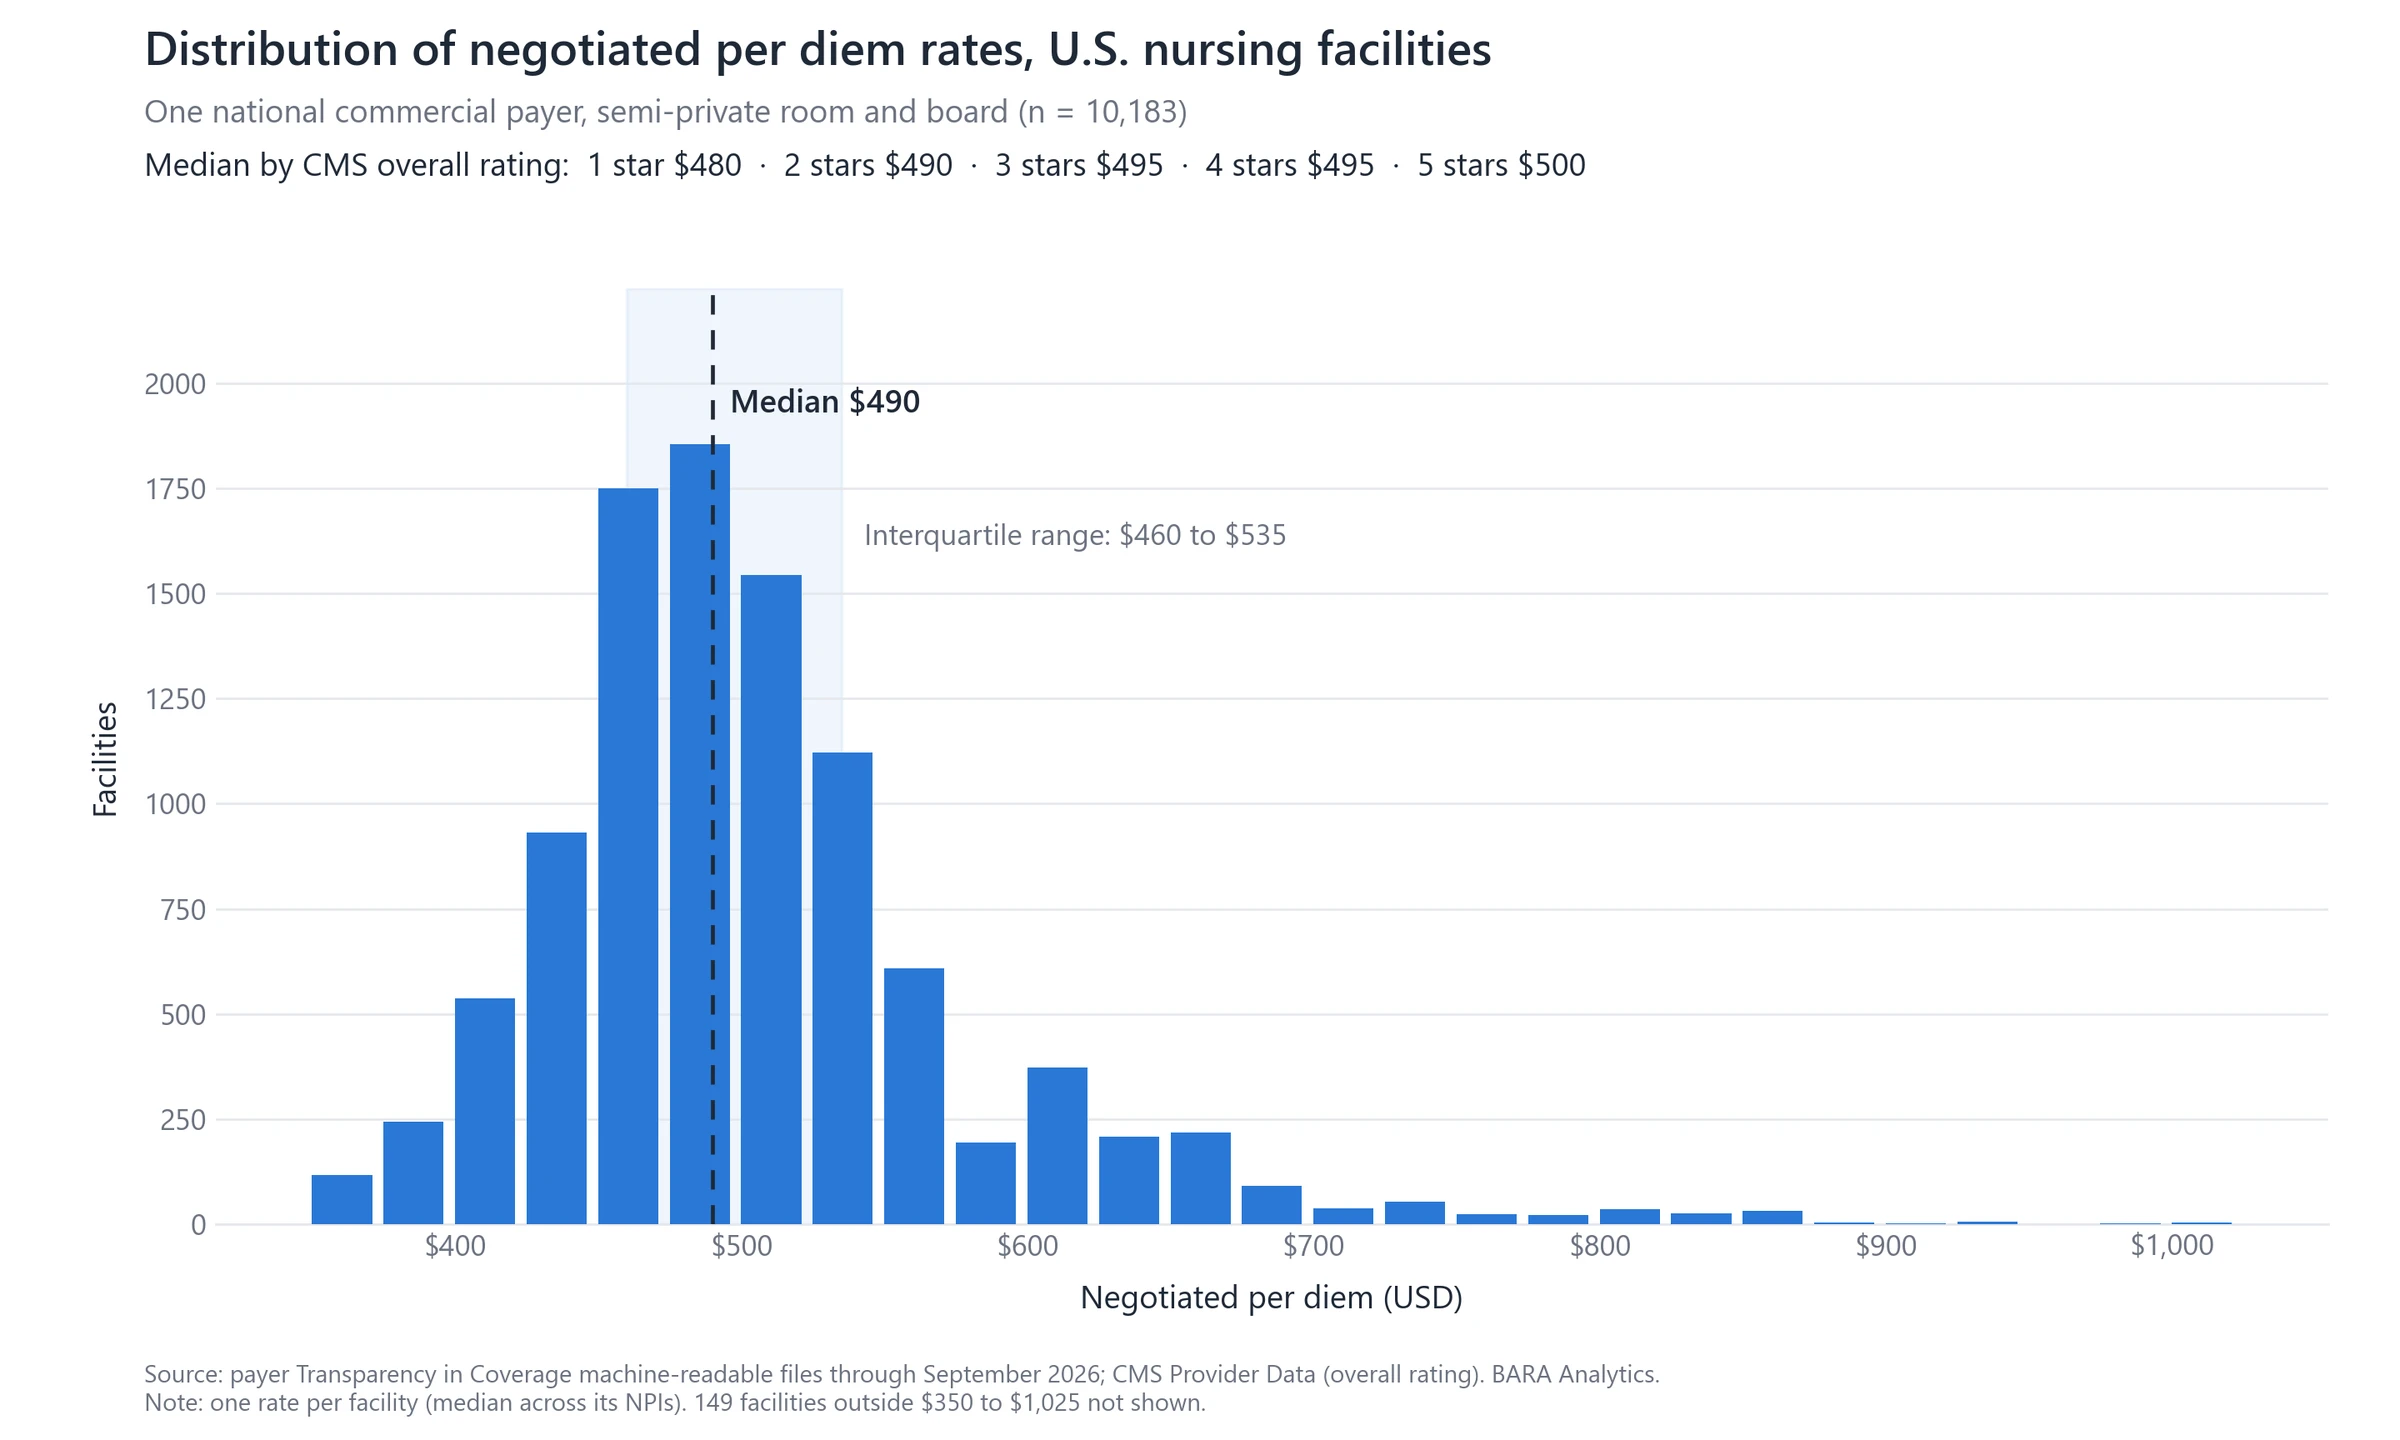
For nursing homes, insurers' Transparency in Coverage files are the only public record of negotiated commercial rates. Across 10,183 facilities, one national payer's median semi-private day is $490, and it moves only from $480 at 1 star to $500 at 5 stars. Most of CMS's new High Performing facilities are paid about what their neighbors are paid. The files leave out Medicare Advantage, which now covers 51.2% of beneficiaries at lower rates, and many of the rates they list are never billed. This page sets out what the files cover, how to read them, and what changes under CMS-9882-F in 2027.
Where the files come from
In June 2019, Executive Order 13877 directed the Departments of Treasury, Labor and HHS to make insurers disclose prices in advance, so patients could weigh price and quality before choosing care. The Transparency in Coverage final rule followed in November 2020. Its stated aims were to help consumers make better-informed spending decisions, let others build tools on the same information, reduce surprise billing, and increase competition to contain costs.
The rule had two parts. Insurers had to post machine-readable files of in-network rates, out-of-network allowed amounts and drug prices for plan years starting in 2022, enforced from July 1, 2022. They also had to give members a personal cost estimate tool, phased in over 2023 and 2024. The files were written for consumers, but they are far too large to read without software. Together they run to hundreds of terabytes, and a single file is often tens of gigabytes once uncompressed, so they are read by software rather than by people. In practice they are used by employers, providers, researchers and data firms.
Why the rates matter
Medicare Advantage now enrolls 51.2% of Medicare beneficiaries and pays nursing homes less: 72 to 83 percent of the fee-for-service day rate in 2021 data compiled by MedPAC (MedPAC, March 2023), and a quarter to a third less in industry analyses (Skilled Nursing News, 2023).
Each stay also costs more to manage and to collect. Ninety-five percent of Medicare Advantage enrollees are in plans that require prior authorization for a nursing-home stay, and 12 percent of those requests were initially denied in June 2024 (KFF, July 2026); continued-stay reviews, appeals and credentialing with each plan add to it. Traditional Medicare reimburses 65 percent of uncollected coinsurance, $217 a day in 2026, as bad debt (42 CFR 413.89(h); CMS); an uncollected Medicare Advantage copay is the facility's loss. Every stay that shifts to Medicare Advantage brings in less and costs more to handle, which makes each negotiated rate, and what the same payer pays the facilities nearby, matter more.
What the files cover
The Transparency in Coverage rule applies to group health plans and to insurers selling group and individual coverage. Several large payers file employer and exchange contracts together, so a file labeled commercial can carry both.
Commercial coverage is a small share of nursing-home days, so the files matter less for that volume than for what they reveal about how each payer prices each facility. A payer's nursing-home network is commonly negotiated once and used across its products, so a published commercial rate can be the visible part of an agreement that also governs exchange and Medicare Advantage members.
| Coverage | In the files | Notes |
|---|---|---|
| Employer group plans | Yes | Fully insured and self-funded |
| Individual and exchange plans | Yes | Often filed alongside employer plans |
| Medicare Advantage | No | Outside the rule |
| Medicaid and CHIP managed care | No | Outside the rule |
| Traditional Medicare | No | Set by CMS; see the PDPM calculator |
| Fee-for-service Medicaid | No | Set by each state; see Medicaid rates by state |
| The nursing home itself | No | Hospital price transparency covers hospitals, not SNFs |
Medicare Advantage: negotiated, not published
Traditional Medicare and Medicaid pay nursing homes administered rates. Medicare's PDPM sets each day's rate from the resident's clinical profile and the local wage index, and every state publishes its Medicaid method. Homes differ widely in who they serve, but every home in a state knows how it is paid.
Medicare's private plans were built on a different premise, from the risk contracts created by the Tax Equity and Fiscal Responsibility Act of 1982, through Medicare+Choice in the Balanced Budget Act of 1997 and Medicare Advantage in the Medicare Modernization Act of 2003: the plan assembles a network and negotiates its own terms with each provider. Those terms are private. Price transparency opened them up for commercial coverage and has not yet done so for Medicare Advantage.
Many payers contract Medicare Advantage separately from commercial, and the files publish no Medicare Advantage rates. But an operator usually knows how its own Medicare Advantage contract with a payer relates to the commercial one: the same rate, a fixed share of it, or priced on a different basis altogether. With that relationship in hand, a competitor's published commercial rate with the same payer becomes a directional read on its Medicare Advantage rate.
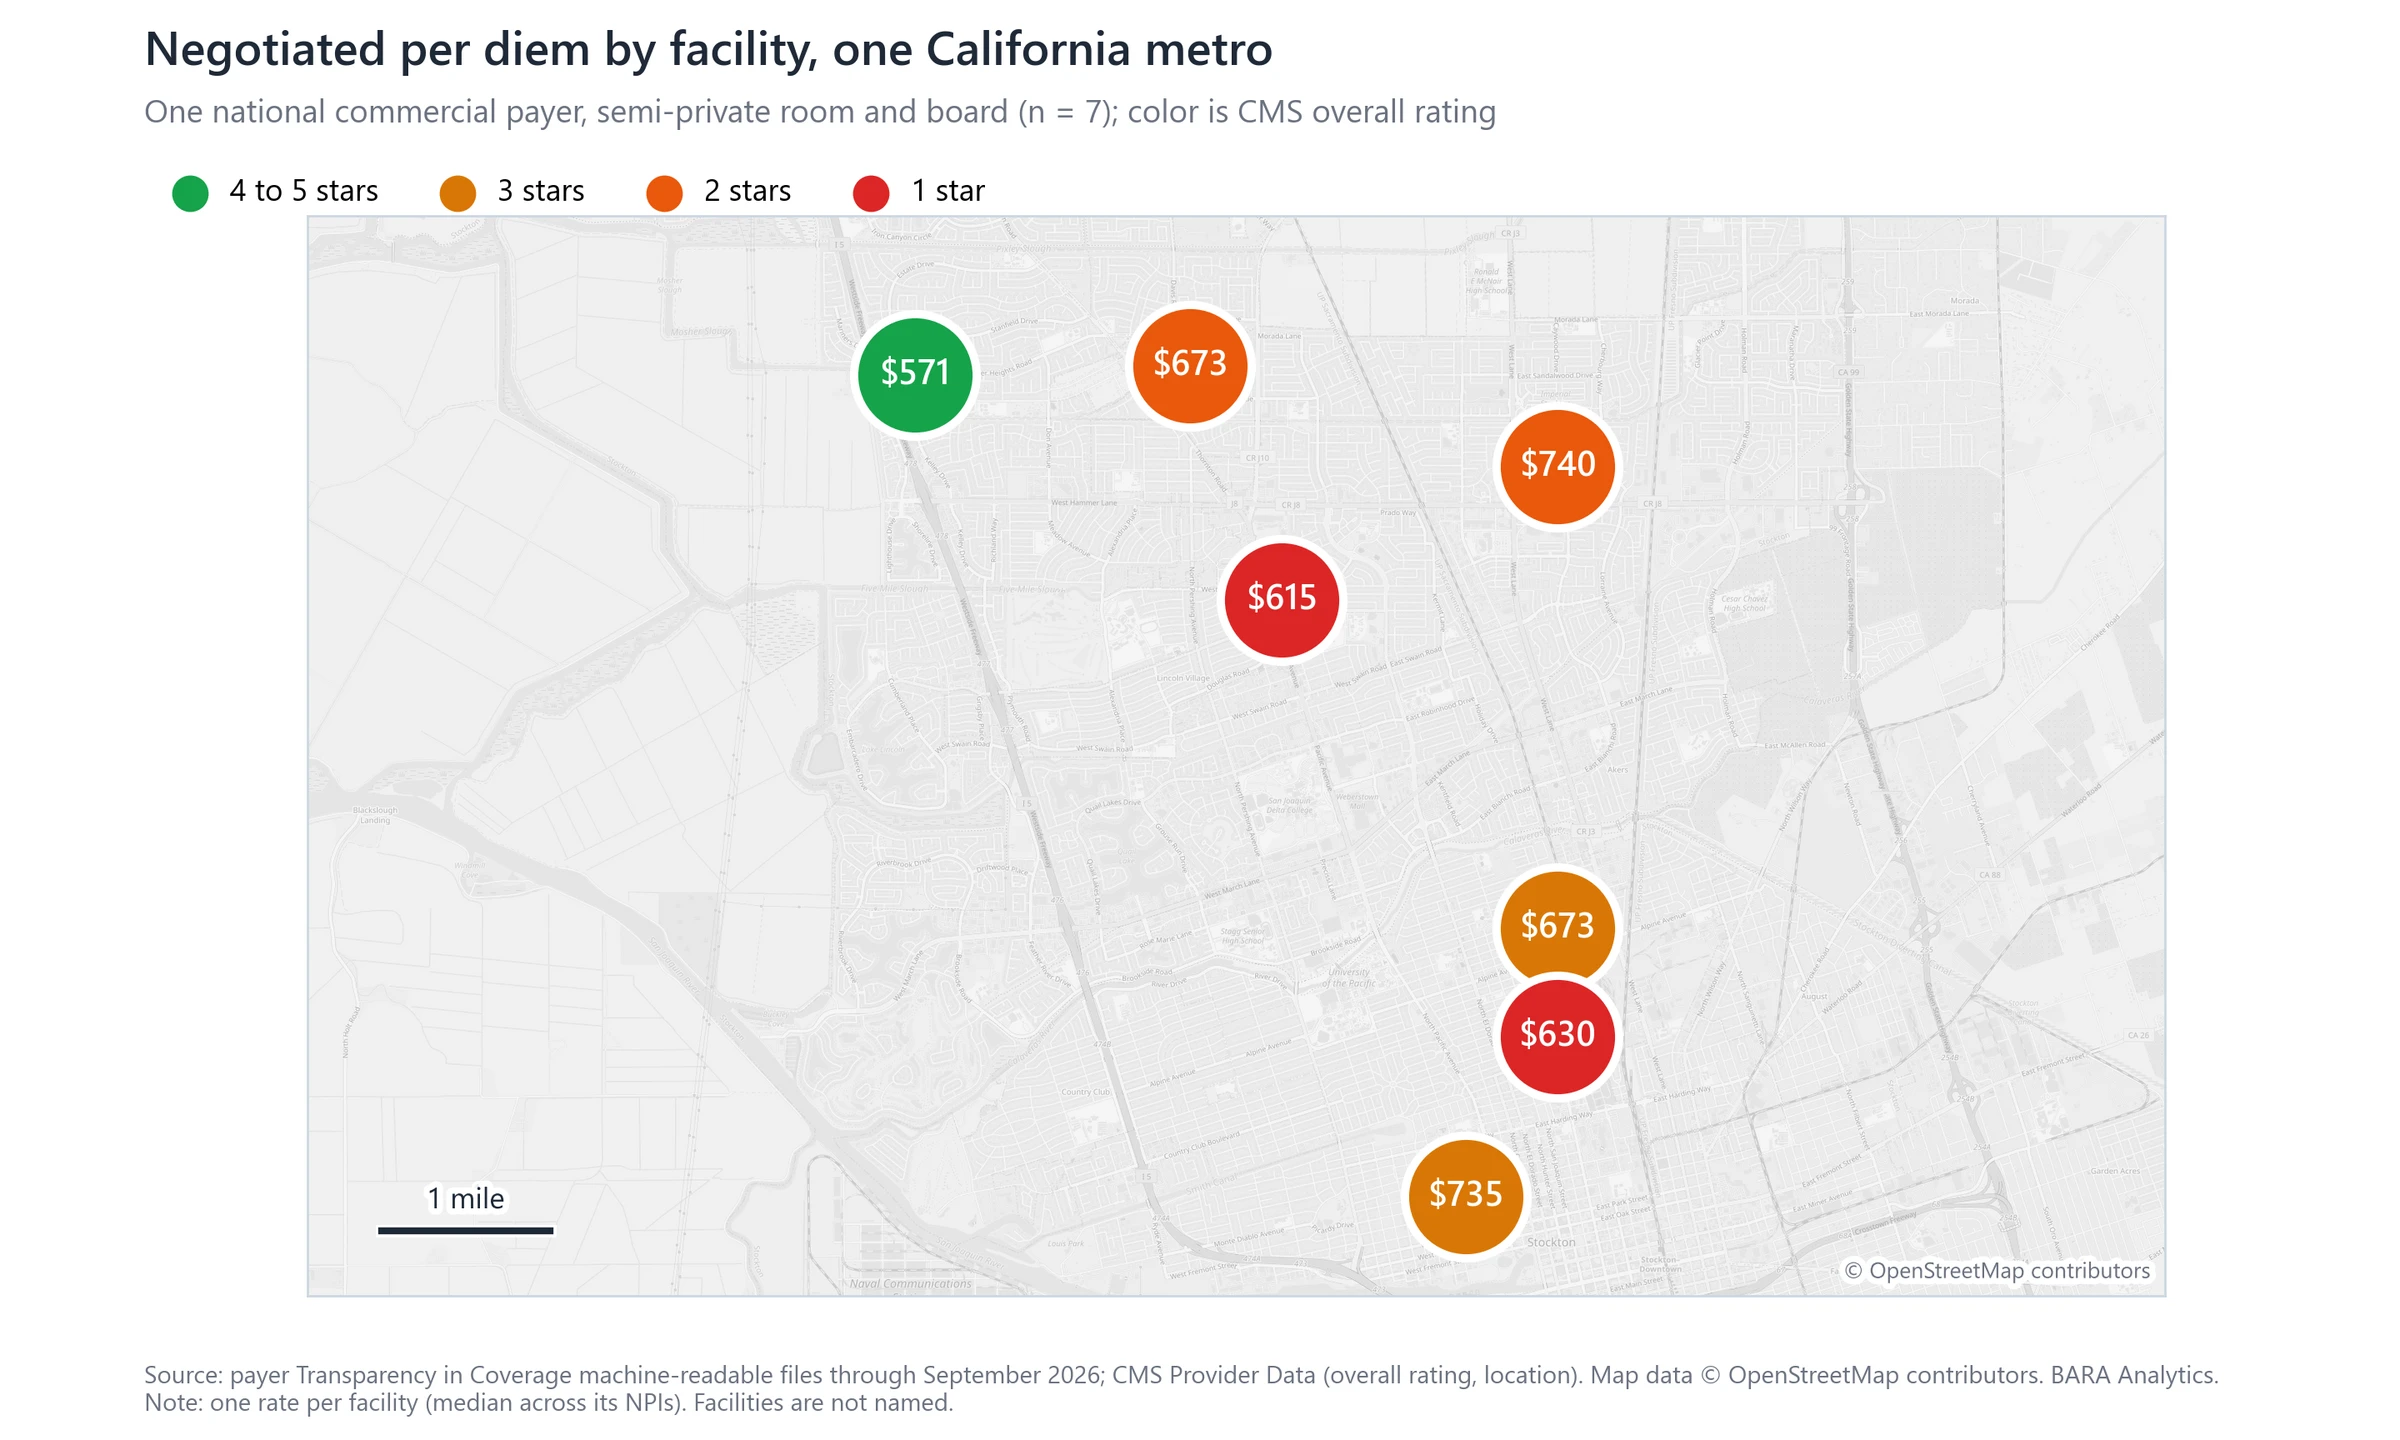
That read matters more each year. Medicare Advantage now enrolls 51.2% of Medicare beneficiaries (CMS, October 2026; see the Medicare Advantage tracker), so a growing share of short-stay residents arrive on terms no one publishes. A directional view of what a payer pays each home in a market, set beside each home's star ratings, staffing and outcomes, shows where a payer's rates follow quality and where they do not.
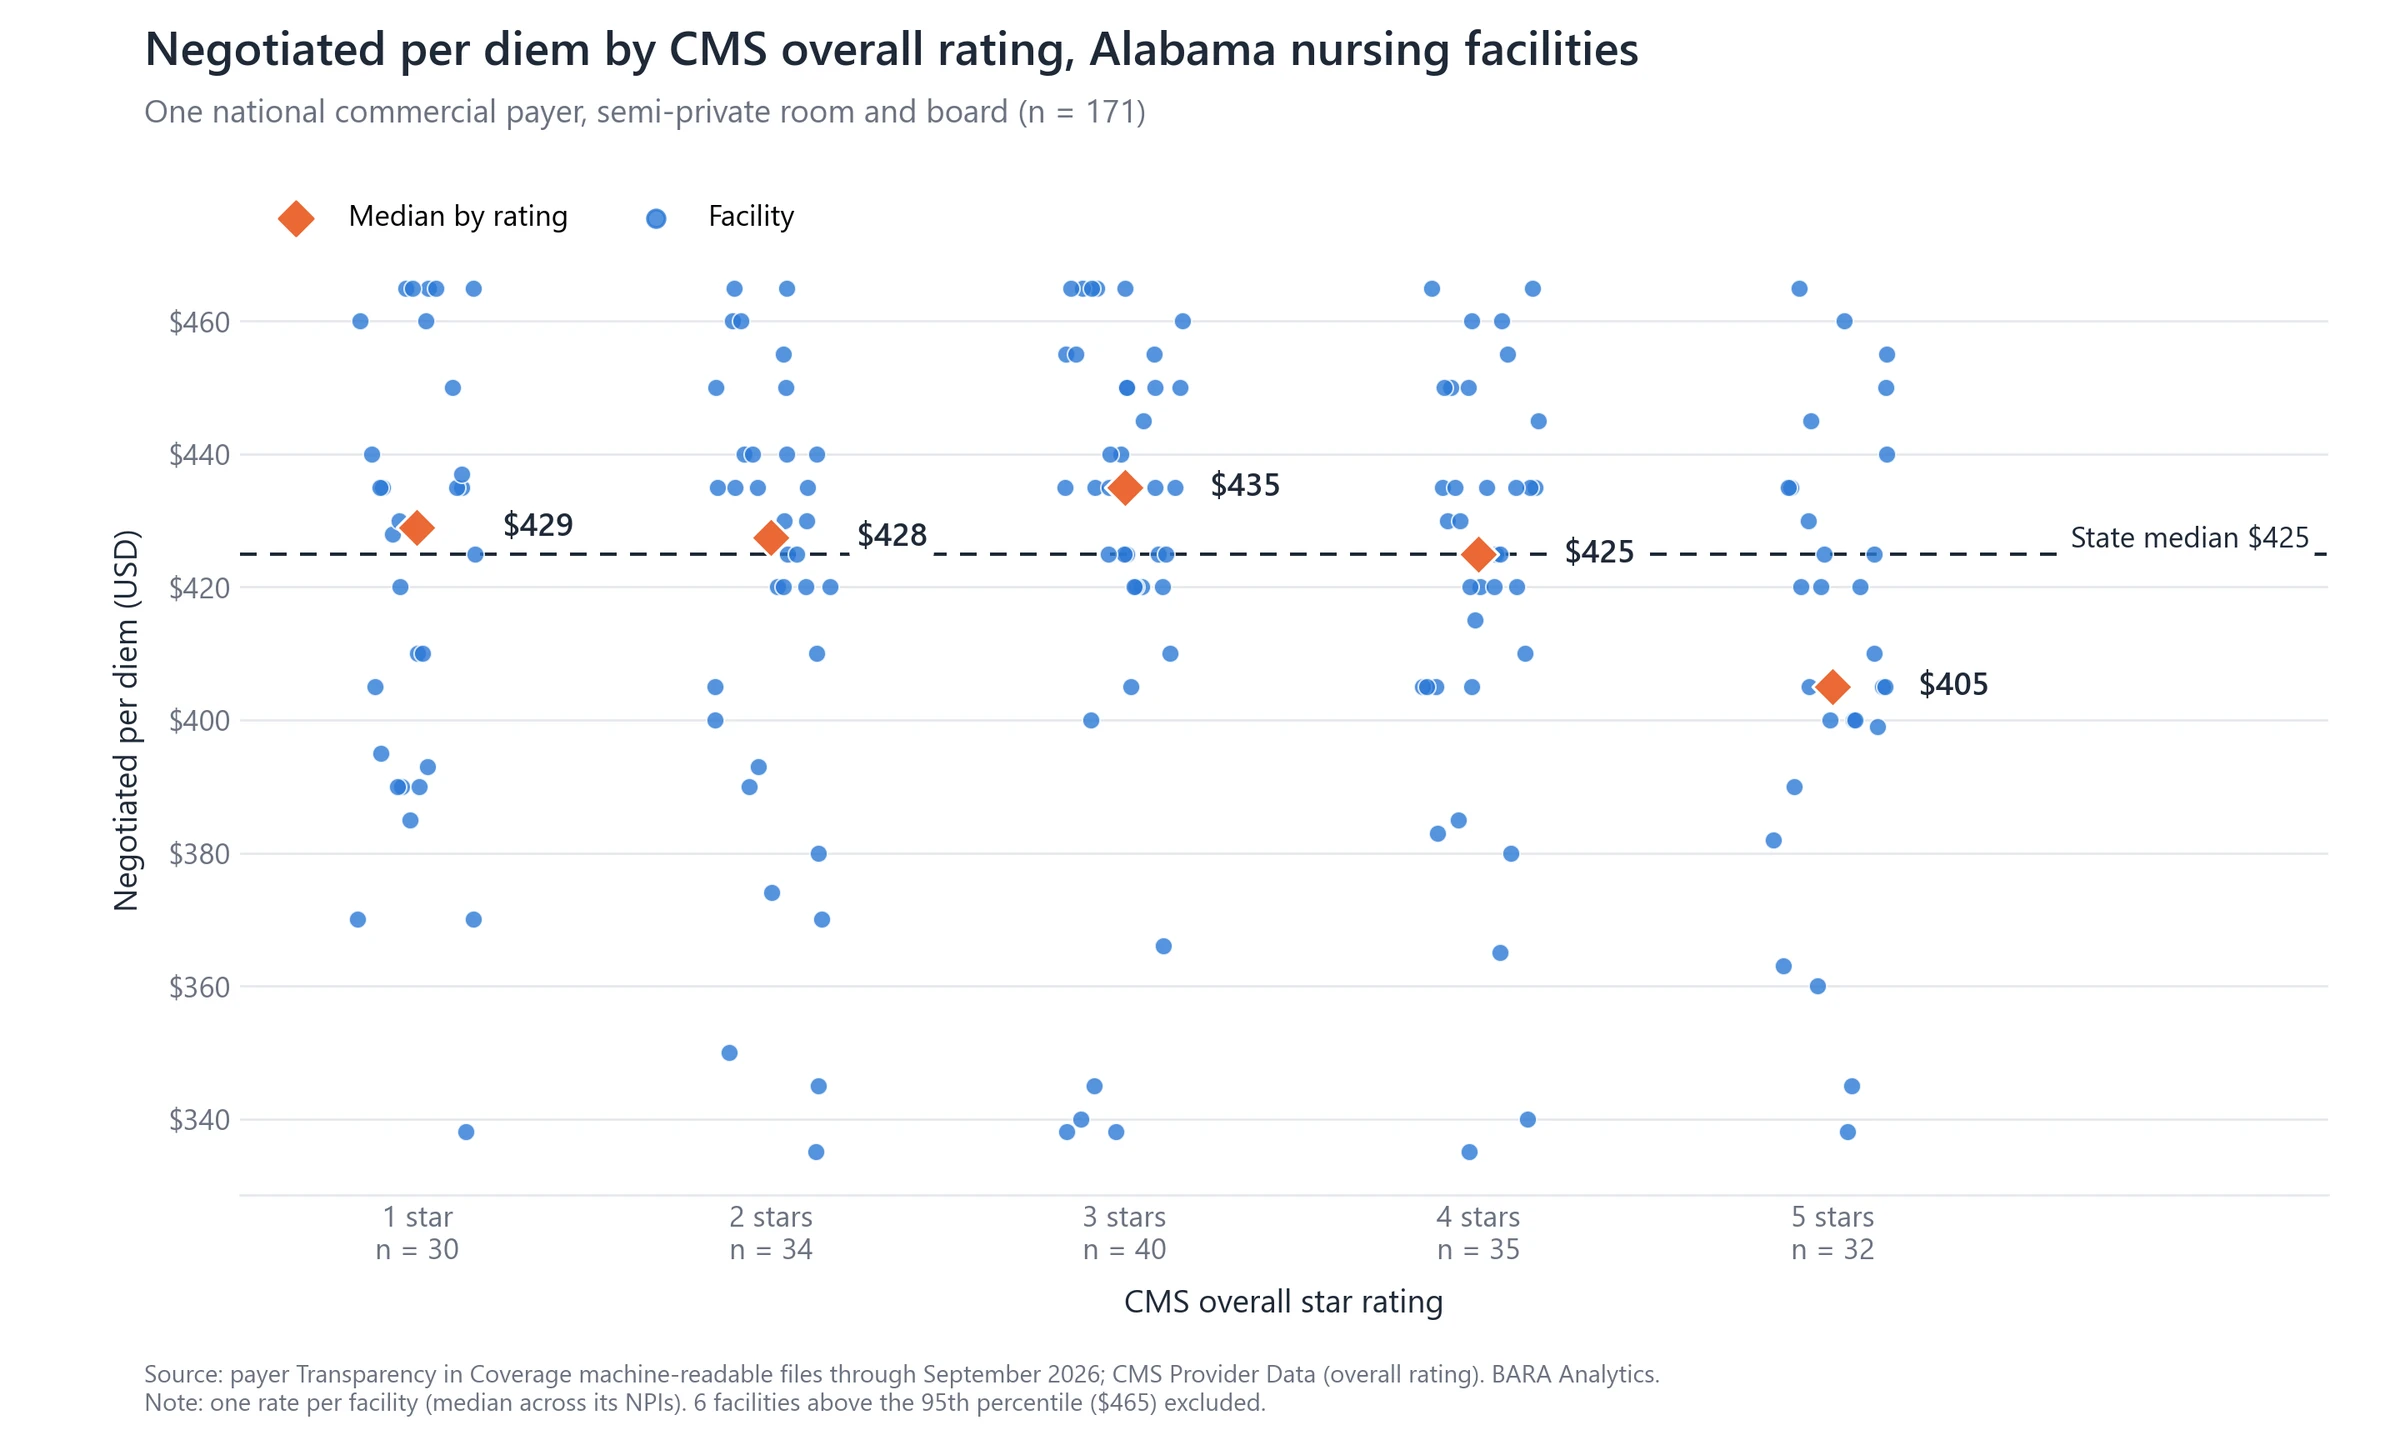
The same pattern holds at scale. Across 10,183 nursing facilities, one national commercial payer's median semi-private per diem is $490, with the middle half of facilities between $460 and $535. The median moves only from $480 at 1 star to $500 at 5 stars. In Alabama, 5-star facilities have the lowest median of any rating, $405, against a state median of $425.
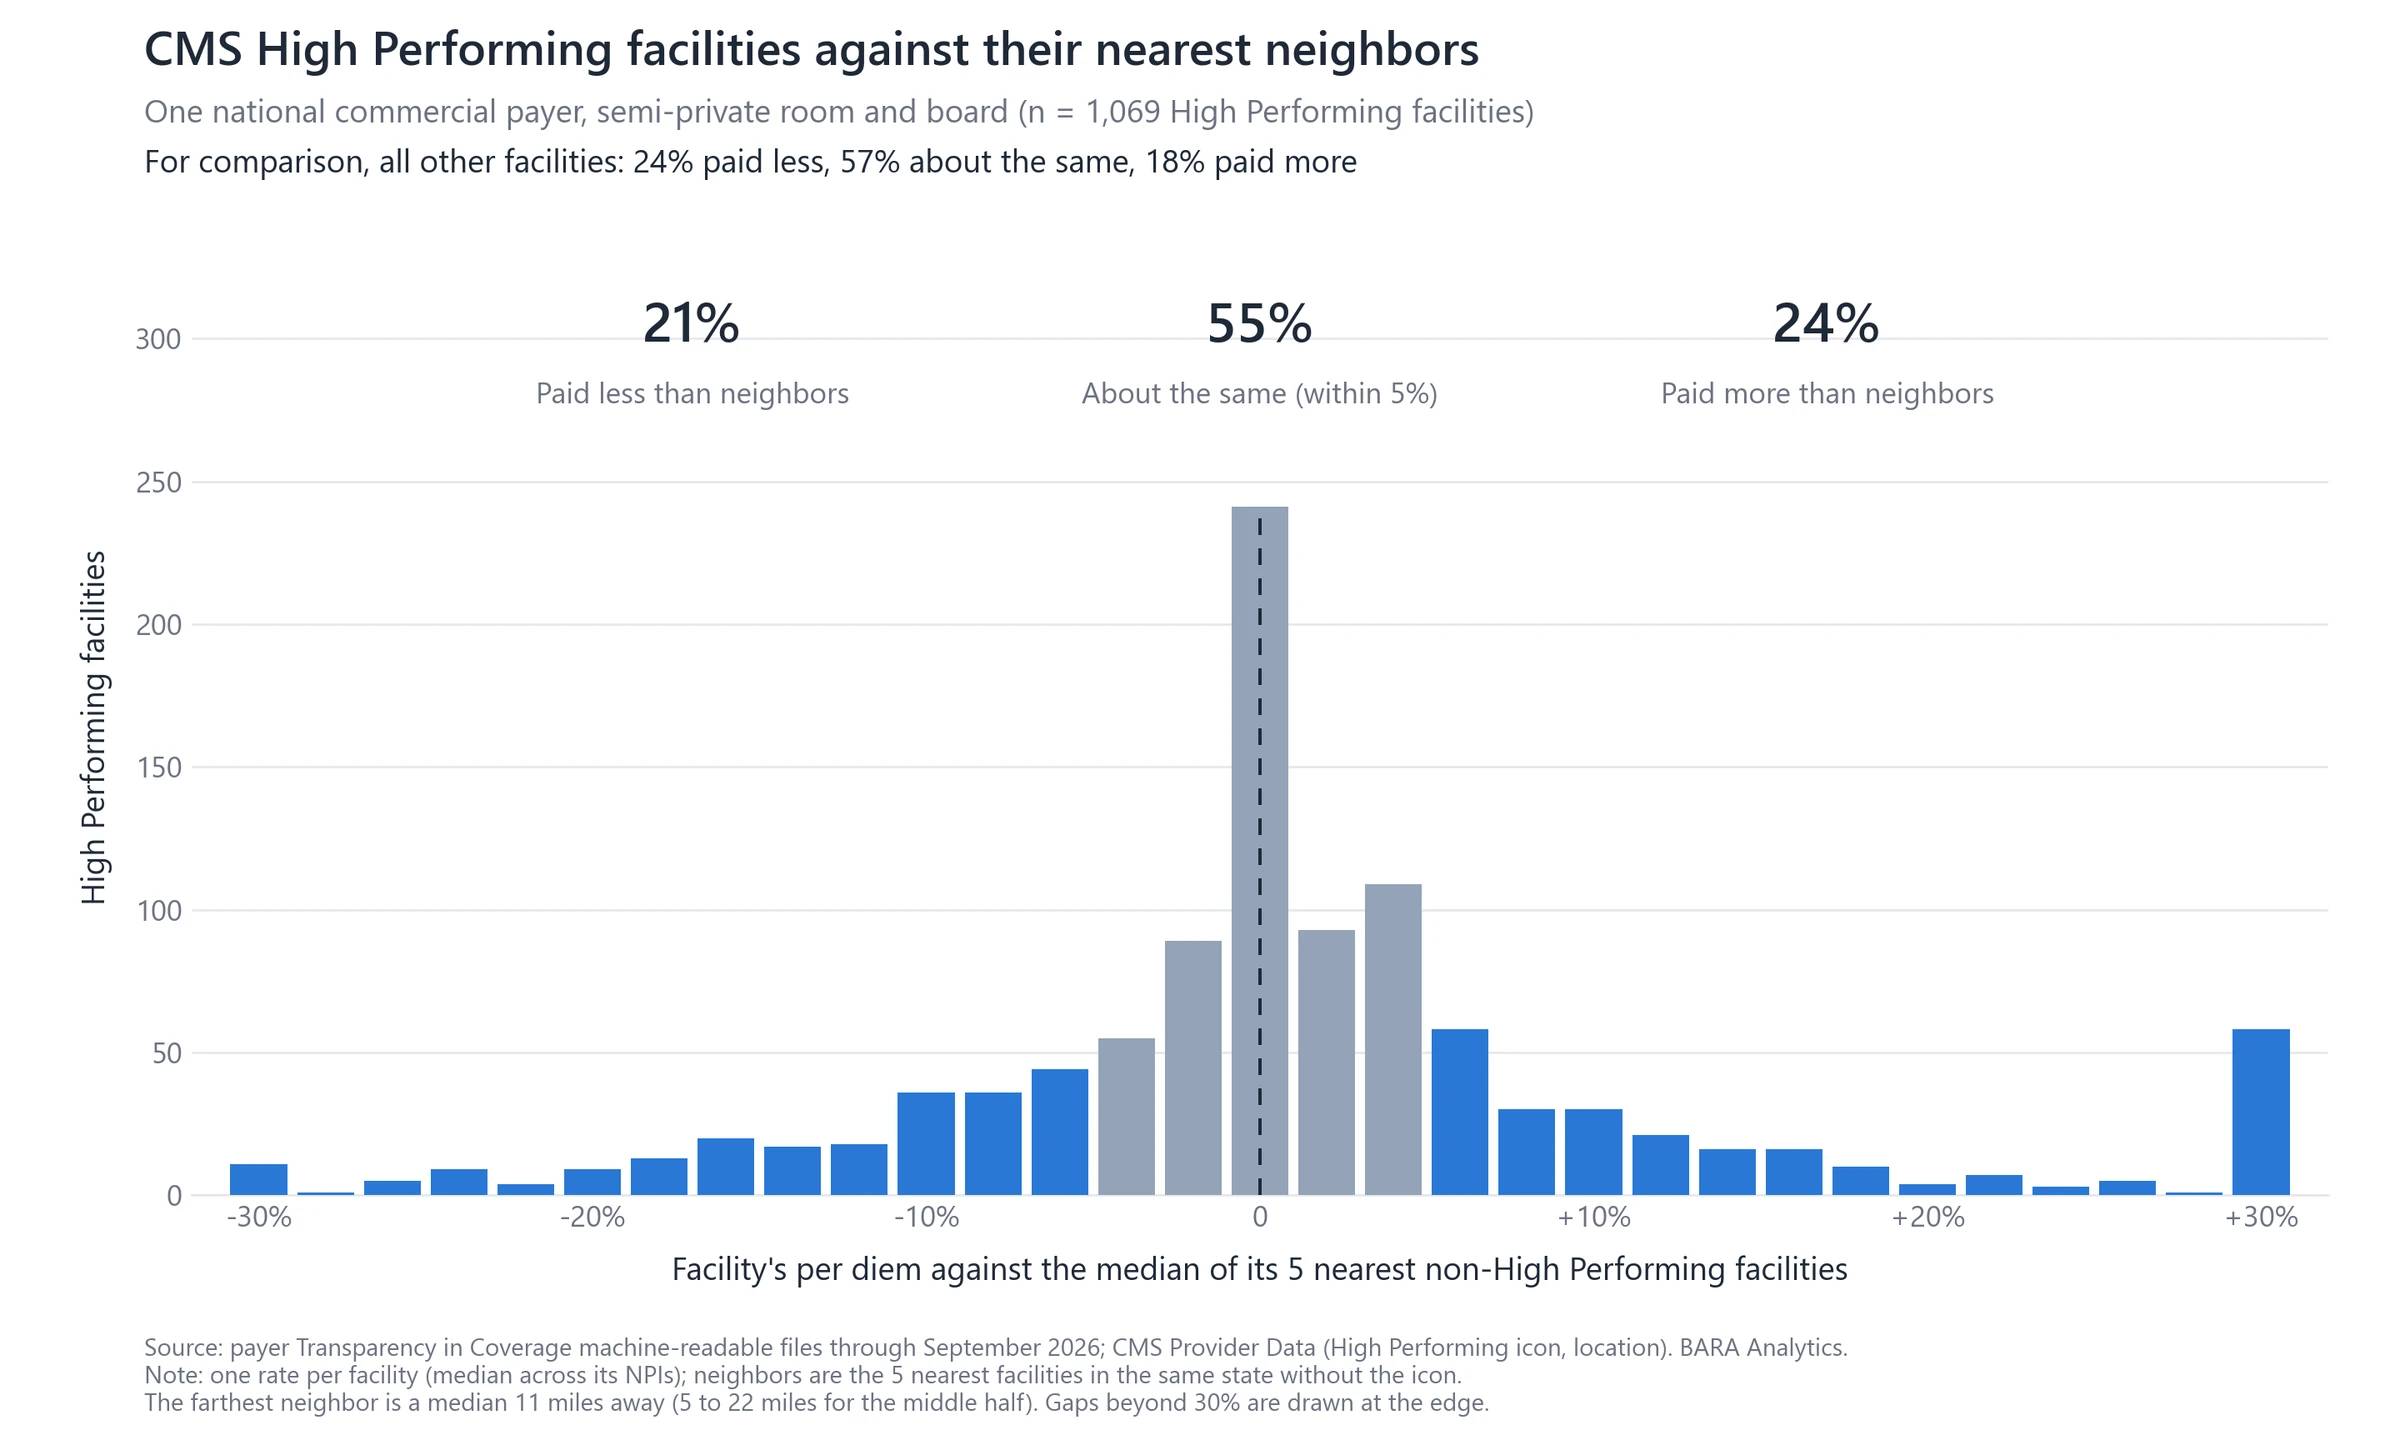
CMS's new High Performing designation shows the same pattern at the local level. CMS first marked these facilities in October 2026, and 1,069 of them have a rate from this payer. Each is compared with the median rate of its 5 nearest facilities in the same state that do not hold the designation. Most are paid about what their neighbors are paid: 55% fall within 5 percent, and 17% match exactly. 24% are paid more and 21% less, only a slight tilt from every other facility, at 18% and 24%. The comparison is local: the farthest of the 5 neighbors is a median 11 miles away, and 5 to 22 miles for the middle half of facilities.
Whether this reflects a pricing inefficiency is an open question. The designation is new: CMS first published it in October 2026, most of these contracts were negotiated before it existed, and CMS refreshes the list each quarter, so a facility can gain or lose it within a single contract term. A payer may reasonably wait to see whether the designation holds before paying for it. If it does hold and rates still do not follow, the gap would point to a market that has not yet priced quality. The quarterly rate files required under CMS-9882-F, beginning in 2027, will make that visible as contracts renew.
None of this means a given rate is wrong. Many things sit behind the differences: case mix and acuity, the services a facility offers, when and how its contract was negotiated, network design, local competition and the facility's own payer mix. A star rating reflects inspections, staffing and quality measures, not everything a payer contracts for. The value is in seeing the pattern. With this data, providers, networks and other healthcare organizations can see where price and quality line up and where they do not, and contract toward a market that is both efficient and high quality.
Why raw files mislead
The files list contracted rates, not paid claims. A contract that prices every code on a fee schedule produces a published rate for every code, whether or not the provider ever bills it: the often-cited case is a pediatrician listed with a price for a heart transplant. In nursing-home data these ghost rates are the norm: the typical payer lists a nursing home on 4 room-and-board codes, though a home bills each payer one way.
| In the raw files, October 2026 | Value |
|---|---|
| Room-and-board codes per home and payer (median) | 4 |
| Home-payer pairs priced on 10 or more room-and-board codes | 20% |
| Home-payer pairs priced on both a semi-private day and a set of care levels | 29% |
| Home, payer and code combinations with more than one price in the same month | 7% |
| Current rates published as a percentage of charges, not dollars | 6% |
Comparing rates across payers adds three more problems. Payers price a day of care in different shapes: one semi-private rate, four or five levels that rise with intensity, or codes of their own. Some payers rent another's network and republish its files, so two names can be one set of contracts. And rates are filed under billing NPIs and tax IDs, not CMS certification numbers, so tying a rate to a building takes its enrollment records.
What CMS-9882-F changes
Treasury, Labor and HHS finalized amendments to the rule on October 5, 2026, published in the Federal Register the next day. Several go straight at the problems above.
| Applies | Change |
|---|---|
| December 7, 2026 | Rule takes effect |
| January 1, 2027 | Cost-sharing estimates available by phone (plan years starting on or after) |
| Early March 2027 |
|
| Early September 2027 |
|
For nursing homes, the utilization file is the largest change: it is the first public signal of which listed providers were actually paid. Network-level files will show when two payer names are one network. Specialty pruning helps less than it sounds, because a nursing home qualifies for every room-and-board code, so the extra codes on its contracts are likely to stay. Nothing in the rule brings Medicare Advantage or Medicaid managed care into the files, and quarterly posting means a new rate can take up to three months to appear.
Coverage by state
Certified nursing homes with at least one current commercial rate, and how many payers publish rates for homes in each state. Rates by home, payer and level are in SNF Insights.
| State | Certified homes | With a rate | Share | Payers |
|---|---|---|---|---|
| Alabama | 224 | 193 | 86% | 7 |
| Alaska | 20 | 7 | 35% | 5 |
| Arizona | 140 | 136 | 97% | 11 |
| Arkansas | 221 | 194 | 88% | 7 |
| California | 1,165 | 986 | 85% | 12 |
| Colorado | 210 | 186 | 89% | 11 |
| Connecticut | 191 | 180 | 94% | 10 |
| Delaware | 44 | 32 | 73% | 11 |
| Florida | 694 | 606 | 87% | 9 |
| Georgia | 356 | 281 | 79% | 12 |
| Hawaii | 43 | 37 | 86% | 5 |
| Idaho | 80 | 71 | 89% | 10 |
| Illinois | 666 | 613 | 92% | 11 |
| Indiana | 507 | 482 | 95% | 12 |
| Iowa | 387 | 357 | 92% | 12 |
| Kansas | 296 | 217 | 73% | 11 |
| Kentucky | 267 | 236 | 88% | 11 |
| Louisiana | 265 | 235 | 89% | 10 |
| Maine | 78 | 65 | 83% | 9 |
| Maryland | 221 | 207 | 94% | 11 |
| Massachusetts | 341 | 275 | 81% | 10 |
| Michigan | 422 | 416 | 99% | 12 |
| Minnesota | 338 | 293 | 87% | 9 |
| Mississippi | 202 | 86 | 43% | 12 |
| Missouri | 487 | 394 | 81% | 10 |
| Montana | 61 | 29 | 48% | 6 |
| Nebraska | 180 | 152 | 84% | 7 |
| Nevada | 66 | 51 | 77% | 11 |
| New Hampshire | 73 | 63 | 86% | 10 |
| New Jersey | 348 | 314 | 90% | 12 |
| New Mexico | 68 | 59 | 87% | 7 |
| New York | 593 | 518 | 87% | 11 |
| North Carolina | 419 | 387 | 92% | 12 |
| North Dakota | 72 | 71 | 99% | 10 |
| Ohio | 922 | 903 | 98% | 12 |
| Oklahoma | 283 | 140 | 49% | 8 |
| Oregon | 128 | 97 | 76% | 7 |
| Pennsylvania | 656 | 607 | 93% | 12 |
| Rhode Island | 72 | 59 | 82% | 6 |
| South Carolina | 187 | 159 | 85% | 11 |
| South Dakota | 96 | 79 | 82% | 9 |
| Tennessee | 303 | 291 | 96% | 12 |
| Texas | 1,177 | 1,095 | 93% | 10 |
| Utah | 97 | 84 | 87% | 11 |
| Vermont | 33 | 24 | 73% | 9 |
| Virginia | 289 | 265 | 92% | 11 |
| Washington | 193 | 171 | 89% | 12 |
| Washington DC | 17 | 12 | 71% | 10 |
| West Virginia | 123 | 104 | 85% | 10 |
| Wisconsin | 323 | 303 | 94% | 11 |
| Wyoming | 36 | 26 | 72% | 11 |
CMS Provider Data, October 2026, and insurer files through 10/5/2026. A home counts once it has one current rate from any payer, in dollars or as a percentage of charges. A payer that republishes another's network counts separately. Omitted: Guam (1), Puerto Rico (9).
Common questions
Do the files include Medicare Advantage or Medicaid managed care rates?
No. Both are outside the rule. An operator that knows how its own Medicare Advantage and commercial contracts with a payer relate can still use a competitor's commercial rate as a directional read on Medicare Advantage.
Do nursing homes publish their own prices?
No. Hospital price transparency covers hospitals only. Insurer files are the only public source of negotiated nursing-home rates.
What is a ghost rate?
A rate published for a provider and service the provider never bills. The often-cited case is a pediatrician listed with a price for a heart transplant: the contract prices the payer's whole fee schedule, so the file lists every code for every provider on it. For a nursing home it is quieter. One payer's current file, for one home:
| Codes listed | Rate |
|---|---|
| 11 room-and-board codes: four room types from private to ward, four care levels meant to rise with intensity, an all-inclusive day and two catch-alls | $500.00 |
| A second all-inclusive code | $541.00 |
| Medicare-style SNF billing code | $6,306.86 |
A private room and a ward bed at the same price, and four levels of care at the same price, are a fee schedule copied onto every code, not thirteen ways the home is paid; a home bills each payer one way. CMS-9882-F requires payers to drop rates a provider is unlikely to be paid for, starting in early March 2027.
Which payers publish nursing-home rates?
The payers we parse are listed on our data page. Coverage varies by state; see the table above.
Sources: MedPAC, March 2023, chapter 7, table 7-7; Skilled Nursing News, May 1, 2023; KFF, Medicare Advantage prior authorization for post-acute care, July 2026; CMS, CY 2026 deductible and coinsurance amounts (MM14279); 42 CFR 413.89; Executive Order 13877, June 2019; Transparency in Coverage final rule (CMS-9915-F), November 2020; Departments of Treasury, Labor and HHS, Transparency in Coverage final rules (CMS-9882-F), October 2026; Public Laws 97-248, 105-33 and 108-173; Congressional Research Service, Medicare+Choice (RL30702, June 2003); CMS Provider Data; insurer machine-readable files.