
Healthcare data infrastructure and market intelligence
We join negotiated payer rates to CMS cost reports, quality, census and enrollment data, so operators, investors and lenders can see how a facility, a chain or a whole market is performing against everyone else in it.
What we do
Know what you are paid
Your commercial rates set against every other rate in the same market: hospital, outpatient rehab, dialysis, home health and more. Providers use it to walk into a payer negotiation knowing where they sit.
How the rate data works →Underwrite a market you cannot visit
Payer mix, census trends, quality, staffing and profitability for a facility, a chain or a whole state. The market context behind a deal, before you commit to it.
Discuss an engagement →Use the data directly
The structured payer-transparency and CMS datasets behind all of it, delivered as clean, queryable data rather than as a report.
Formats and access →The rates are public. Using them is the work.
Since July 2022 health plans have had to publish every rate they negotiate. What they publish is hundreds of gigabytes of nested JSON per payer, every rate keyed to identifiers that mean nothing until they are resolved. We parse it at scale and join it to CMS cost reports, quality and enrollment.
{ "billing_code_type":"MS-DRG",
  "billing_code":"023",
  "negotiated_rates":[
   {"provider_groups":[
      {"npi":[1093······],
       "tin":{"type":"ein",
              "value":"46·······"}}],
    "negotiated_prices":[
      {"negotiated_type":"negotiated",
       "negotiated_rate":24188.55,
       "service_code":["21"],
       "billing_class":"institutional"}]},
   { ... 2,400,000 more rows ... }
  ]}
Rates in the database are years of ingest. Rate lines read is a separate running total the parser began keeping in September 2026. They are not two ends of one pipe.
SNF Insights
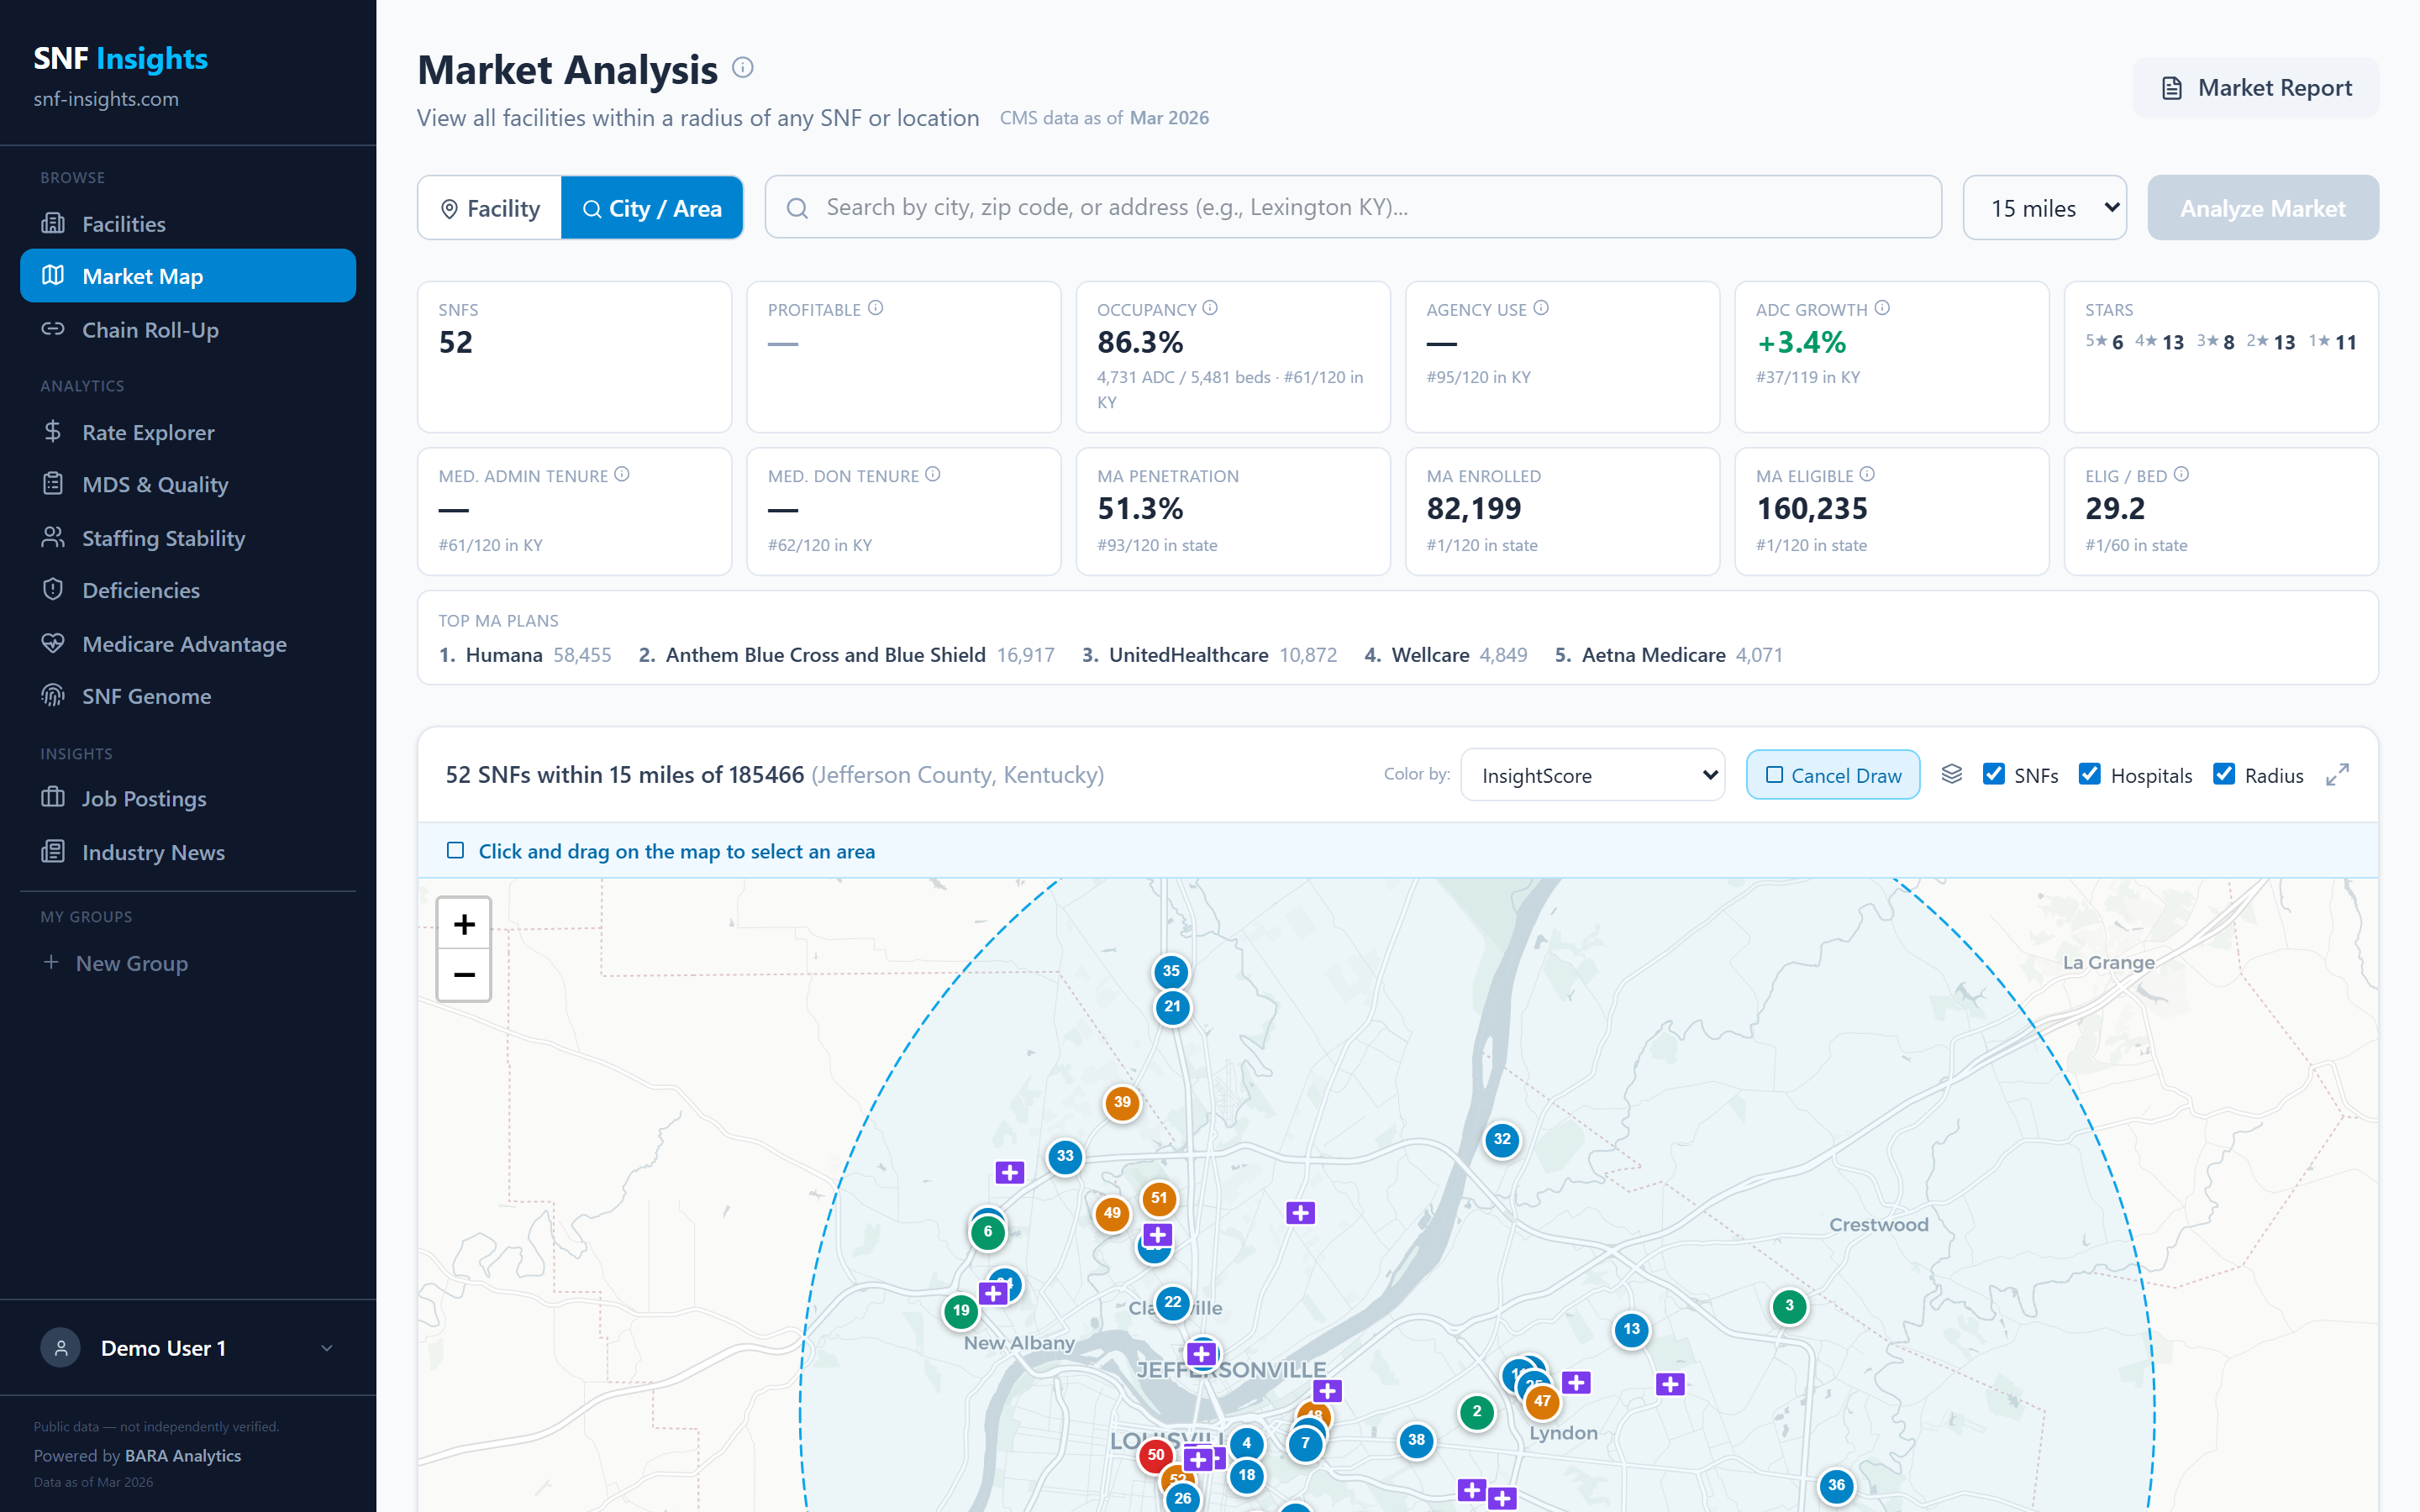
The subscription platform where a market’s facilities, quality, census, payer mix, and negotiated rates come together on one screen. Know where any facility or chain stands, and where it is gaining or losing share.
Free tools
On the same reimbursement data behind our client work. No sign-up, no email.
PDPM Calculator →
Price a Medicare Part A skilled nursing stay on the current CMS rates.
Rates current for federal fiscal year 2026Medicare Advantage Penetration →
How much of a market has moved to Medicare Advantage, by state and county, with ten years of trend.
CMS enrollment release September 2026“BARA Analytics, led by Brett, provided valuable analytics and visibility into outpatient rehabilitation reimbursement by parsing massive payer datasets into clear, market intelligence. Their insights gave us valuable regional context during a major payer negotiation and strengthened our position for fair reimbursement. In addition, the data played a key role in educating our network members about the value of Primary Care Physical Therapy and the impact they have within today’s musculoskeletal healthcare delivery.”
Ty Berrett, Executive Director
Western Rehabilitation Health Network
(WRHN), serving Utah & Idaho
Contact
For a look at SNF Insights, a consulting engagement, or a data partnership: